
Key Takeaways
- Engagement rate is more valuable than follower count for SMBs measuring social media success
- Website traffic and conversion metrics directly connect social media efforts to business revenue
- SMBs should prioritize quality metrics like sentiment analysis over vanity metrics
- Social media ROI is measurable through proper tracking of leads, conversions, and customer acquisition costs
- Sprout Social’s analytics tools help small businesses efficiently track and interpret the metrics that matter most
Drowning in data but thirsty for results? That’s the reality for many small business owners trying to make sense of their social media performance. With dozens of metrics available across multiple platforms, figuring out which numbers actually impact your bottom line can feel overwhelming.
As a small business, your time and resources are limited. You need to focus on the social media metrics that directly contribute to business growth, not just the ones that look impressive in reports. Sprout Social’s comprehensive analytics platform helps SMBs cut through the noise to identify and track the metrics that truly matter for sustainable growth and meaningful ROI.
The Only Social Media Metrics Small Businesses Need to Track
When it comes to social media marketing, not all metrics deserve your attention. While platforms offer numerous data points, smart SMBs focus on metrics that align with specific business objectives. The right metrics help you understand if your social media efforts are actually generating revenue, building brand awareness, or improving customer relationships.
“Don’t measure everything you can. Measure what you should.”
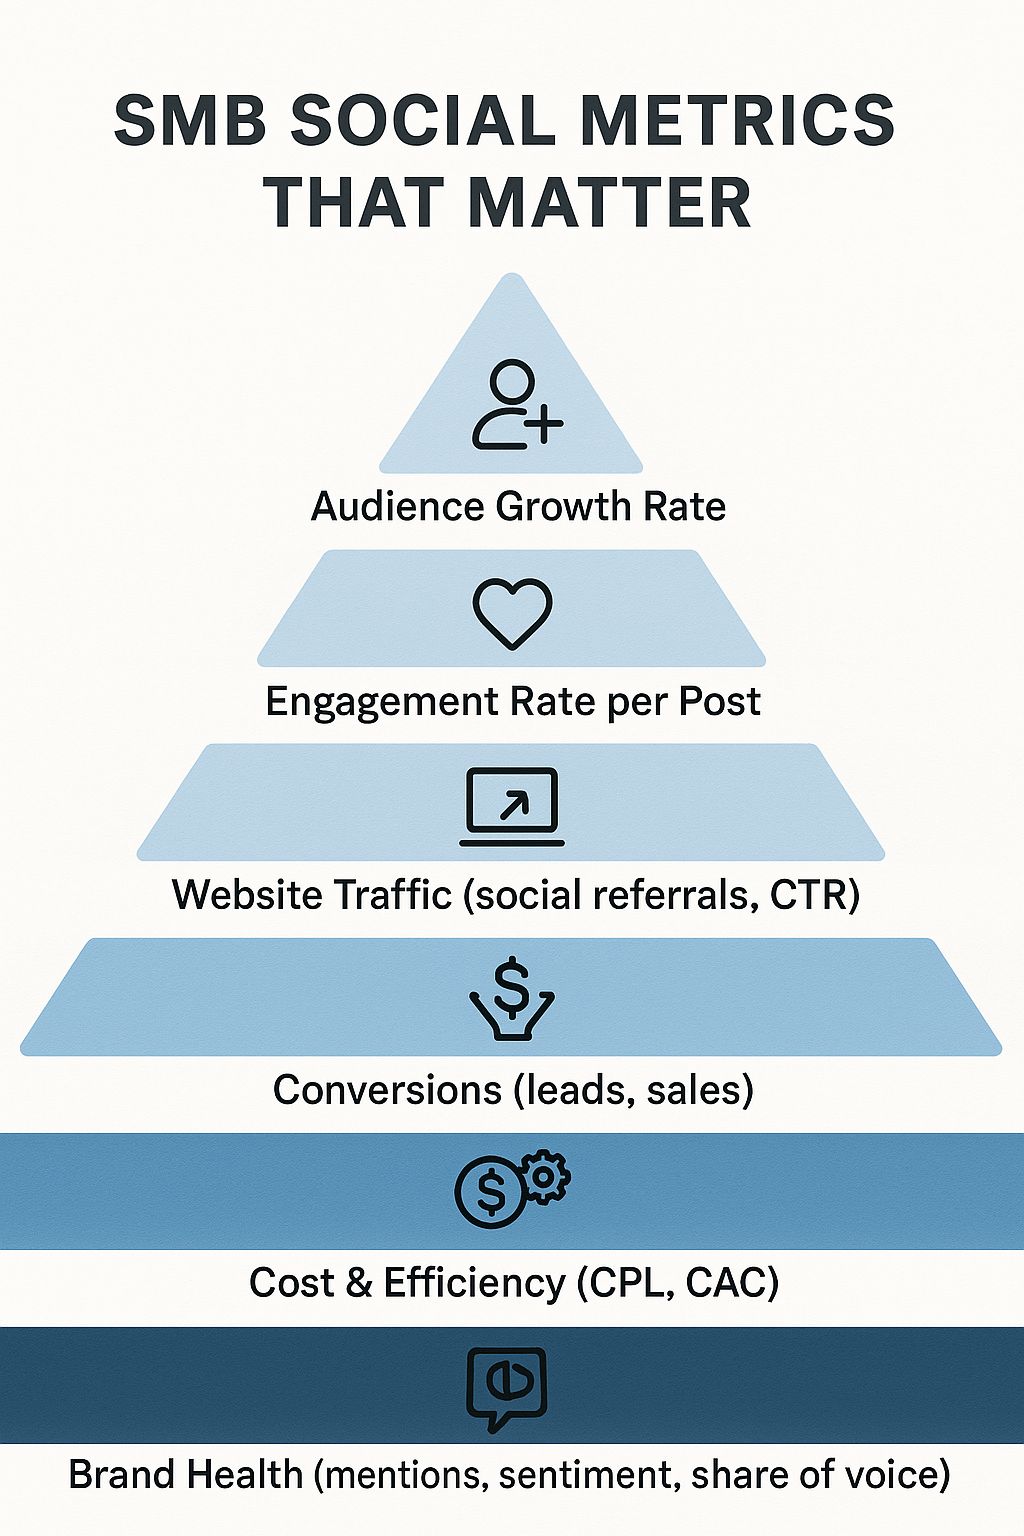
Rather than spreading yourself thin tracking dozens of metrics, focus on these key categories: audience growth, engagement, website traffic, conversions, brand health, and content performance. Each category provides distinct insights into how your social media strategy impacts different aspects of your business.
Why Most SMBs Waste Time on Vanity Metrics
It’s tempting to chase impressive-looking numbers. Many small businesses fall into the trap of obsessing over vanity metrics—numbers that might look good on paper but don’t translate to actual business results. Follower counts, likes, and even impressions can be misleading if viewed in isolation.
These surface-level metrics feel good when they trend upward but often mask deeper issues with your social strategy. Having 10,000 followers means little if they never engage with your content, visit your website, or make purchases. The engagement rate of a smaller, more targeted audience typically delivers more value than raw numbers.
Instead of celebrating reaching arbitrary follower milestones, smart SMBs track metrics that reveal audience quality and business impact. This shift in focus transforms social media from a vanity project into a legitimate business development channel.
The Business Impact of Measuring What Matters
When you track the right metrics, social media becomes a powerful business tool rather than just another marketing expense. Proper measurement allows you to connect social media efforts directly to revenue generation, customer acquisition, and retention—the metrics that business owners and stakeholders actually care about.
Tracking business-oriented metrics also improves resource allocation. By understanding which platforms, content types, and campaigns generate the best returns, you can optimize your social media budget and focus team efforts where they’ll have the greatest impact. This precision is particularly crucial for SMBs with limited marketing resources.
Social media data, when properly analyzed, also provides valuable customer insights that can inform product development, customer service improvements, and overall business strategy. This makes your social media program not just a marketing channel but an intelligence-gathering operation for your entire organization.
Audience Growth Metrics That Actually Drive Business
Growing your audience matters, but how you measure that growth determines whether it translates to business results. Rather than obsessing over total follower count, focus on metrics that reveal audience quality and potential value to your business. For instance, enhancing your ecommerce experiences can be a crucial step in attracting a more engaged and valuable audience.
Follower Growth Rate vs. Raw Follower Count
Raw follower count tells an incomplete story. Your follower growth rate—the percentage increase in followers over a specific time period—provides more actionable insights, especially when correlated with your marketing activities. This metric helps you understand which initiatives actually attract new followers and at what pace your audience is expanding. For more insights on social media metrics, check out Sprout Social’s guide.
Calculate your follower growth rate by taking the number of new followers gained in a period, dividing by your starting follower count, and multiplying by 100. For more insights, you can check out Sprout Social’s guide on social media metrics. For example, if you started January with 1,000 followers and ended with 1,200, your monthly growth rate was 20%.
Tracking growth rate over time reveals trends that raw numbers might obscure. A sudden spike might indicate successful content or campaigns, while a plateau or decline signals the need for strategy adjustments. Consistent, sustainable growth typically indicates a healthy social media approach.
Audience Quality Indicators
Not all followers are created equal. Audience quality metrics help determine if your social accounts are attracting the right people—those likely to become customers. Key quality indicators include demographic alignment with your target market, geographic relevance to your service area, and professional characteristics that match your ideal customer profile.
Reach to Follower Ratio
The reach to follower ratio reveals how effectively your content extends beyond your current audience. This metric divides your average reach by your total follower count, with higher percentages indicating greater content distribution beyond your existing followers. A strong ratio typically ranges between 25-50%, while anything above 50% suggests viral potential.
This metric proves particularly valuable for SMBs because it demonstrates your content’s ability to reach potential new customers without additional ad spend. When your organic content consistently achieves high reach relative to your follower base, you’re effectively getting free advertising and maximizing the return on your content creation investment.
Engagement Metrics Worth Your Time
Engagement metrics reveal how effectively your content resonates with your audience. Unlike vanity metrics, meaningful engagement indicates potential for relationship-building and conversion. For small businesses, these metrics directly correlate with word-of-mouth marketing and community building—both crucial for sustainable growth.
The right engagement metrics help you understand not just if people see your content, but if they find it valuable enough to interact with. This insight allows you to refine your messaging and create more of what works, ultimately improving all other performance metrics downstream.
Engagement Rate Per Post
Engagement rate per post offers a standardized way to measure content performance regardless of audience size. Calculate this by dividing total engagements (likes, comments, shares, saves) by your follower count, then multiply by 100. This percentage allows for fair comparison between posts and helps identify your highest-performing content types.
Comments and Meaningful Interactions
Comments represent higher-value engagement than passive actions like likes. They indicate that your content prompted enough emotional response or interest to motivate viewers to contribute their thoughts. Track not just comment quantity but also quality—thoughtful questions and detailed responses indicate deeper audience connection than generic praise or emoji reactions. For those in the ecommerce sector, enhancing ecommerce experiences can significantly boost meaningful interactions.
Shares and Amplification
Shares represent the ultimate engagement metric because they indicate content so valuable that users want to associate themselves with it and distribute it to their networks. This amplification expands your reach without additional cost and comes with the implied endorsement of the sharer, making it more powerful than paid distribution.
Click-Through Rate
Click-through rate (CTR) bridges the gap between social engagement and website traffic. This metric calculates the percentage of people who clicked on your link after seeing your post. Low CTR despite good engagement suggests a disconnect between your content and call-to-action, while a high CTR indicates effective messaging alignment.
Website Traffic Metrics That Connect Social to Sales
Social media should drive qualified traffic to your website, where conversion opportunities exist. Website traffic metrics help you understand not just how many visitors come from social channels, but their quality and likelihood to convert. These metrics prove invaluable when justifying social media investment to stakeholders.
By properly tracking website traffic from social sources, you create a clear line of sight between your social media efforts and business results. This connection makes social media accountability possible and helps identify the most effective platforms for your business objectives.
Social Referral Traffic
Social referral traffic measures visitors who reach your website directly from social media platforms. This metric shows which platforms drive the most traffic and how that traffic changes over time in response to your content strategy. Tools like Google Analytics allow you to segment this traffic by platform, campaign, and content type to identify your most effective traffic-driving approaches.
Landing Page Bounce Rate from Social
Bounce rate measures the percentage of social media visitors who leave your website without taking any action or visiting additional pages. A high bounce rate may indicate a mismatch between your social content promises and your website experience, poor page loading speed, or confusing navigation. Optimizing landing pages specifically for social traffic can dramatically improve this metric and ultimately lead to higher conversion rates.
Pages Per Session from Social Visitors
The number of pages viewed during each visit from social media channels indicates visitor engagement with your website content. Higher pages-per-session suggests visitors are finding your content relevant and exploring more of what you offer, increasing opportunities for conversion. This metric helps evaluate whether social traffic is merely passing through or genuinely interested in your offerings.
Track this metric against your overall site average to understand if social visitors engage more or less deeply than visitors from other sources. If social visitors consistently view fewer pages, your targeting may need refinement or your social content may set incorrect expectations.
Conversion Metrics to Prove Social ROI
For small businesses, social media must ultimately drive revenue to justify its cost. Conversion metrics directly tie your social media activities to business results, making them the most valuable metrics to track and report. Without conversion tracking, you’re essentially operating your social media program on faith rather than data.
Setting up proper conversion tracking requires some technical implementation but provides invaluable insight into which platforms, content types, and campaigns generate real business value. This visibility enables data-driven budget allocation and strategy refinement based on actual return on investment.
Lead Generation from Social Channels
Track how many leads originate from each social platform by implementing UTM parameters on your links and conversion tracking on your lead capture forms. This metric reveals which platforms deliver not just traffic, but qualified prospects interested in your offerings. Compare lead volume and quality across platforms to determine where to concentrate your social media efforts for maximum return.
Cost Per Lead
Cost per lead divides your total social media spending (including content creation, management tools, and advertising) by the number of leads generated. This calculation helps determine if your social media investment delivers reasonable returns compared to other marketing channels. For most B2B companies, a cost per lead below $75 indicates efficient social media performance, while B2C businesses typically target under $20 per lead.
Conversion Rate by Platform
Different social platforms attract users with varying purchase intent and consideration stages. Track conversion rates separately for each platform to identify which channels are most effective at driving business results for your specific offering. This insight helps optimize both organic content strategy and paid advertising budgets across platforms.
Brand Health Metrics for Long-Term Growth
Brand health metrics measure how people perceive your business on social media platforms. These qualitative indicators provide valuable context for quantitative metrics and help predict future performance. For small businesses, a strong brand reputation often compensates for smaller marketing budgets by generating organic word-of-mouth promotion.
While engagement and conversion metrics show immediate returns, brand health metrics reveal the long-term impact of your social strategy. They help you gauge whether your social presence is building a foundation for sustainable growth or simply chasing short-term gains at the expense of reputation.
Brand Mentions
Brand mentions track how often users reference your company across social platforms, even when they don’t tag your profile directly. This metric captures unsolicited conversations about your brand, which often carry more credibility with potential customers than your own marketing messages. Tools like Sprout Social’s listening features help monitor mentions across multiple platforms, providing a comprehensive view of your brand’s social footprint.
Beyond tracking volume, analyze mention context to understand what’s driving conversations. Are mentions clustered around product features, customer service experiences, or company news? This insight helps identify which aspects of your business resonate most strongly with your audience.
Sentiment Analysis
Sentiment analysis evaluates whether social media mentions of your brand skew positive, negative, or neutral. This qualitative metric provides crucial context for quantitative measurements like mention volume. After all, a surge in negative mentions indicates a problem, not a success, regardless of how it affects your overall metrics. For more insights, explore Sprout Social’s guide on social media metrics.
Most social media management tools now offer automated sentiment analysis, though human review remains important for catching nuances like sarcasm that algorithms might miss. Track sentiment trends over time and in relation to specific campaigns or events to understand how different activities impact brand perception.
Share of Voice
Share of voice compares your brand’s social media presence against competitors. Calculate this by dividing your brand mentions by the total mentions in your category (your mentions plus those of key competitors) and multiplying by 100. This percentage shows your relative visibility in industry conversations.
A growing share of voice indicates your brand is gaining prominence within your market. Track this metric quarterly to assess your competitive position and the effectiveness of your content strategy compared to industry peers. For small businesses, even a modest increase in share of voice can signal significant competitive progress.
Customer Service Metrics on Social
Social media has evolved into a critical customer service channel where response quality and speed directly impact brand perception. For small businesses, excellent social customer service creates a competitive advantage against larger companies that may struggle with personalization and response times.
Tracking customer service performance on social channels helps identify pain points in your customer experience and opportunities to strengthen relationships. These metrics not only measure service quality but also contribute to overall engagement and sentiment metrics.
Response Time
Response time measures how quickly your team replies to customer messages and comments on social media. Today’s consumers expect rapid responses—42% expect replies within 60 minutes, while 32% expect a response within 30 minutes. For small businesses, fast response times demonstrate attentiveness and can compensate for limitations in other resources.
Set internal benchmarks based on your industry and resources, then work to consistently meet or exceed them. For most small businesses, responding within four business hours represents a reasonable target, with acknowledgments within one hour during business hours for urgent issues. For more insights on enhancing customer interactions, consider exploring ecommerce experiences.
Resolution Rate
Resolution rate tracks the percentage of customer issues that your team successfully resolves through social media channels without requiring escalation to other departments or communication methods. A high resolution rate indicates efficient customer service processes and well-trained social media staff.
Improving this metric often involves creating standardized response frameworks for common issues and empowering your social media team with the authority to resolve problems directly. Track resolution rate alongside customer satisfaction to ensure issues aren’t being “closed” without actually satisfying customers. For more insights on enhancing customer experiences, explore how eCommerce platforms are evolving.
Customer Satisfaction Scores
Customer satisfaction scores measure how effectively your social media service meets customer expectations. Collect this data through simple post-interaction surveys or by tracking positive and negative feedback following service interactions. For social channels, even requesting a simple “thumbs up” if the issue was resolved satisfactorily can provide valuable data. To dive deeper into how these metrics can influence your business, check out this guide on social media metrics.
Compare satisfaction scores across channels to identify whether social media service performs better or worse than other customer service touchpoints. This comparison helps determine whether to invest more resources in social customer care or focus on improving other channels.
Content Performance Metrics to Refine Your Strategy
Content performance metrics reveal which types of posts resonate with your audience, allowing you to refine your content strategy for maximum impact. For small businesses with limited content creation resources, these insights ensure you invest in producing the right content rather than wasting time on formats or topics that don’t engage your audience.
Track performance patterns across content categories to identify trends and establish benchmarks specific to your brand. Over time, these metrics build a playbook for content that consistently delivers results for your business.
Top-Performing Content by Type
Analyze engagement rates, click-through rates, and conversion metrics across different content formats (video, images, text, polls, etc.) to identify which types perform best for your specific audience. Most businesses find that different content types excel at different objectives—videos might drive awareness while link posts generate more website traffic.
Create a content performance dashboard that segments metrics by content type, topic, and campaign to identify patterns. Use these insights to allocate your content creation budget toward formats proven to deliver results aligned with your business goals.
Best Times to Post
Posting time significantly impacts content performance, particularly for algorithm-driven platforms. Track engagement metrics in relation to posting times to identify when your specific audience is most receptive. This pattern recognition helps maximize organic reach without additional content creation costs.
Look beyond general best practices to identify patterns unique to your audience. Many social media management tools offer time optimization features that analyze your specific audience’s activity patterns and recommend personalized posting schedules.
Video Completion Rate
Video completion rate measures the percentage of viewers who watch your video content from beginning to end. This metric provides deeper insight than view counts, revealing whether your videos maintain audience interest throughout. Low completion rates may indicate that your videos are too long, fail to deliver on the promise of their titles, or lose viewer interest after the opening sequence.
Compare completion rates across different video lengths and styles to determine the optimal format for your audience. Many businesses discover that shorter videos (under 60 seconds) achieve significantly higher completion rates while delivering the same key messages. For more insights on how to enhance customer engagement, consider exploring enhancing eCommerce experiences.
Track drop-off points within longer videos to identify where viewer attention wanes. These insights help you restructure content to place key messages before common drop-off points and maintain engagement throughout the duration of your videos. For more strategies on maintaining engagement, explore Sprout Social’s insights on social media metrics.
Creating Your 15-Minute Social Media Dashboard
With dozens of metrics across multiple platforms, efficient monitoring requires a streamlined dashboard focused on your most important indicators. A well-designed dashboard enables quick assessment of social media performance and identifies issues requiring deeper investigation, all within a 15-minute daily review.
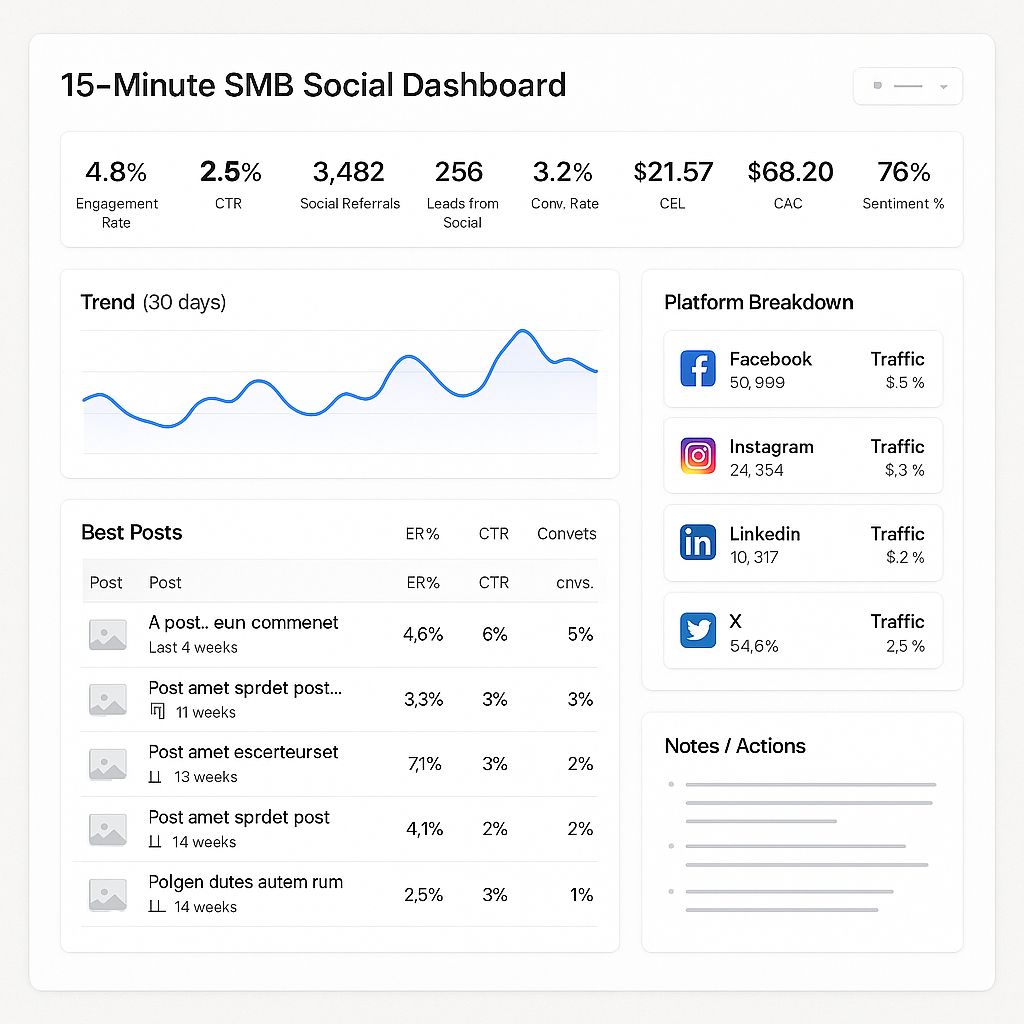
The most effective dashboards combine high-level KPIs that provide an overall performance snapshot with platform-specific metrics that drive tactical adjustments. This balanced approach ensures you stay focused on business outcomes while optimizing day-to-day execution.
Essential Tools for SMBs on a Budget
Small businesses don’t need enterprise-level tools to track meaningful metrics. Several affordable platforms offer comprehensive analytics capabilities suitable for SMBs. Sprout Social provides unified cross-platform reporting with customizable dashboards starting at plans designed for small business budgets. For businesses with very limited budgets, native platform analytics combined with financial platforms like Google Analytics and a simple spreadsheet can track essential metrics effectively.
When selecting tools, prioritize those that automate data collection and visualization while offering flexibility to focus on your specific KPIs. The right tool saves hours of manual data gathering and enables more time for analysis and strategy adjustment based on insights.
Weekly vs. Monthly Reporting
Establish a rhythm of weekly tactical reviews and monthly strategic assessments to balance responsiveness with meaningful trend analysis. Weekly reviews should focus on immediate performance indicators like engagement rates and top-performing content, while monthly reviews examine broader metrics like audience growth, website traffic patterns, and conversion trends.
Connecting Metrics to Business Goals
The most valuable social media dashboard connects metrics directly to business objectives. For each business goal, identify the social media metrics that serve as leading or lagging indicators of success. For example, if increasing new customer acquisition is a priority, track metrics like new followers from target demographics, engagement from non-followers, and first-time website visitors from social channels.
Regularly revisit these connections to ensure your measurement framework evolves alongside your business priorities. This alignment ensures social media remains accountable to business outcomes rather than becoming an end unto itself.
Turn Your Social Media Numbers Into Business Growth
Data collection only creates value when translated into strategic action. The final step in effective social media measurement is using insights to improve business performance through better decision-making, resource allocation, and strategy refinement.
How to Present Social ROI to Stakeholders
When communicating social media performance to business stakeholders, focus on business outcomes rather than platform-specific metrics. Translate engagement and reach figures into business value by connecting them to leads generated, sales influenced, customer retention improvements, or cost savings compared to other marketing channels.
Using Data to Improve Content Strategy
Leverage performance metrics to continuously refine your content approach. Identify topics, formats, and messaging styles that consistently outperform others, then adjust your content calendar to emphasize these proven performers while testing new variations to prevent audience fatigue. For more insights, explore social media metrics that can guide your strategy.
Create a feedback loop where content performance directly influences future content planning. This data-driven approach improves results over time while making more efficient use of limited content creation resources.
When to Pivot Based on Performance
Establish clear thresholds that trigger strategy reassessment. For example, if engagement rates fall below 50% of your benchmark for three consecutive weeks, or if conversion rates drop by more than 25% month-over-month, these indicators suggest the need for significant adjustments rather than minor tweaks. For further insights, consider exploring Sprout Social’s guide on social media metrics.
When metrics indicate the need for a pivot, conduct a structured review to determine whether the issue stems from content quality, audience targeting, platform algorithm changes, or external market factors. This diagnostic approach ensures you address root causes rather than symptoms. For more insights on evaluating these metrics, check out Sprout Social’s guide on social media metrics.
Frequently Asked Questions
Social media measurement generates common questions from small business owners seeking to maximize their return on investment while minimizing complexity. These answers address the most frequent concerns about implementing effective measurement practices.
How often should small businesses review their social media metrics?
Small businesses should establish a tiered review schedule: daily quick checks (5-10 minutes) for notifications and urgent issues, weekly tactical reviews (30 minutes) to assess content performance and make immediate adjustments, and monthly comprehensive analysis (1-2 hours) to evaluate progress toward business goals and refine strategy.
This balanced approach prevents both overreaction to normal performance fluctuations and delayed response to significant trends. For businesses with very limited resources, weekly tactical reviews combined with monthly strategic assessments provide a minimum viable measurement framework.
Remember that different metrics have different useful reporting intervals. Engagement metrics benefit from weekly monitoring to guide content adjustments, while conversion trends and audience growth require monthly or quarterly analysis to reveal meaningful patterns.
What’s the difference between reach and impressions for SMBs?
Reach counts unique users who see your content, while impressions track total content views, including multiple views by the same users. For small businesses, reach typically provides more valuable insight into audience expansion, while impressions help evaluate content visibility and frequency. When building awareness is your goal, prioritize reach metrics; when reinforcing messages to existing audiences, focus on impressions.
Which social media platform typically delivers the best ROI for small businesses?
The platform with the best ROI varies significantly based on business type, target audience, and objectives. B2B companies typically see stronger returns from LinkedIn, while consumer brands often perform better on Instagram or Facebook. Rather than following general recommendations, track platform-specific conversion rates and cost per acquisition to determine which channels deliver the best returns for your specific business.
Do follower counts still matter in 2023?
Follower counts matter primarily as a foundation for other metrics and as social proof for potential customers evaluating your business. The quality of followers and their engagement levels matter far more than raw numbers. A smaller, highly engaged audience of potential customers typically delivers better business results than a larger but disinterested following.
What’s the minimum budget needed for effective social media measurement?
Effective measurement is possible with minimal financial investment by utilizing free native analytics tools from social platforms, Google Analytics for website traffic analysis, and spreadsheets for tracking and visualization. The primary investment required is time—approximately 2-4 hours monthly for analysis and reporting. As your social program grows, consider investing in tools that automate data collection and visualization to improve efficiency.
With the right metrics in place, even small businesses with limited resources can create data-driven social media strategies that deliver measurable business results. Focus on metrics that directly connect to your business goals, establish efficient measurement processes, and consistently use insights to refine your approach.
Small businesses that master social media measurement transform what many see as a necessary marketing expense into a predictable engine for business growth. By focusing on the metrics that matter, you’ll not only improve social media performance but also strengthen your overall business strategy.
Turn those “nice” metrics into revenue metrics: centralize DMs, email/SMS, and forms, auto-tag UTMs, track leads-to-sales by post, and spin up a 15-minute dashboard that shows CAC, LTV, and real ROI. Start free and get a growth consult at em2bos.com.

