
Main Points
- Catalyst Pro is a tool that CMOs use to show clear marketing ROI, thanks to unified attribution tracking and real-time data visualization tools
- By bridging the gap between marketing activities and business outcomes, the platform addresses a key problem that 76% of marketing executives face
- Five key metrics, including CAC, CLV:CAC ratio, and multi-touch attribution, are used to convince board members of the strategic value of marketing
- By using Catalyst Pro, CMOs have managed to secure budget increases of up to 30% by turning complex data into compelling executive narratives
- Customizable dashboards in the platform provide immediate answers to tough board questions, shifting CMOs from defensive reporting to strategic partnership
Every three months, CMOs are in the hot seat: they stand before the board, trying to justify marketing spend while connecting campaigns to revenue. This task has never been more difficult in today’s data-driven business environment. Thankfully, Catalyst Pro is changing the way marketing leaders show their value to the C-suite, turning this quarterly ordeal into an opportunity for strategic influence.
Today’s enterprise CMOs and VPs of Marketing are under immense pressure to demonstrate the value of their marketing efforts in an environment that is increasingly data-driven and budget-conscious. With the Catalyst Pro platform from Agility, marketing leaders now have the ability to close the gap between marketing activities and business results using sophisticated analytics that are designed specifically for executive presentations. The platform is transforming the way CMOs communicate value, shifting from defensive reporting to strategic partnership with the board.
Why CMOs Have a Hard Time Proving Marketing ROI to the Board
When it comes time for the board to review marketing budgets, the room is always filled with tension. Sales can show the deals they’ve closed and finance can show their margins, but marketing has always had a hard time with attribution. A recent study from Gartner showed that 76% of marketing leaders have trouble showing how their marketing activities have impacted their business objectives and financial outcomes. This disconnect creates a credibility gap that can hurt marketing’s strategic position.
Board members who are primarily concerned with business growth and profitability often don’t understand traditional marketing metrics. Vanity metrics, such as impressions, reach, and engagement, may look good on marketing dashboards, but they can leave CFOs and CEOs wondering how they relate to the bottom line. If marketing departments can’t clearly show how their spending is generating revenue, they risk having their budgets cut and losing influence.
The main problem arises from scattered data sources, uneven attribution models, and the incapacity to convert marketing activities into financial terminology that executives comprehend. Marketing efforts frequently influence the business through numerous touchpoints over lengthy time periods, making direct attribution challenging. When board members inquire about marketing’s contribution to quarterly outcomes, many CMOs do not have the tools to give confident, data-supported responses.
Why CMOs are Turning to Catalyst Pro for Clear ROI Reporting
Designed to tackle the core issue of marketing attribution, Catalyst Pro offers a complete platform tailored for C-suite communication. It is not just another analytics tool. Instead, Catalyst Pro was developed with the boardroom in mind, concentrating on the metrics and visualizations that are most important to executive decision-makers. It also seamlessly integrates with existing martech stacks to provide a unified view of marketing performance.
Catalyst Pro changes the game for marketing leaders when it comes to ROI. It links together data points that were once isolated to create comprehensive customer journey maps that clearly show the impact on revenue. This enables CMOs to shift from focusing on activity metrics to results-oriented reports that show the direct influence of marketing on business growth. Catalyst Pro automates complex attribution calculations, freeing marketing teams to concentrate on strategic insights instead of wrestling with data.
Keeping Track of Marketing Attribution Across All Channels
Catalyst Pro’s strongest feature is its ability to keep track of all marketing attribution across both digital and traditional channels. The platform keeps track of touchpoints throughout the customer’s journey, from awareness campaigns to conversion activities, and uses advanced attribution models to accurately distribute credit for generating revenue. This all-encompassing view gets rid of the common problem of reporting that is specific to each channel and fails to show the interconnected nature of today’s marketing.
Catalyst Pro is able to generate detailed attribution pathways by placing cross-channel tracking codes and integrating with CRM systems, marketing automation platforms, and advertising networks. This means that if a potential customer sees a social media ad, visits your website after a trade show, and finally converts through an email campaign, each touchpoint is appropriately credited. This gives a clear picture of how different marketing initiatives work together to generate revenue.
When CMOs present to boards, this unified attribution means that they no longer have to grapple with explaining how brand awareness campaigns ultimately impact the bottom line. The platform offers clear visualizations that show how upper-funnel activities are tied to revenue, providing marketing leaders with the tools they need when they are asked difficult questions about long-term investments versus immediate returns.
- Integration with digital channels such as Google Analytics, social media platforms, and advertising networks
- Tracking of offline channels via QR codes, vanity URLs, and promotional codes
- Integration with CRM to capture the entire customer journey from the initial touch to the final deal
- Customized attribution models that reflect your specific sales cycle and customer journey
Visualization of Real-Time Revenue Impact
Catalyst Pro converts vague marketing data into convincing visual stories through its real-time revenue impact dashboards. These visualizations go beyond static reports to illustrate the dynamic connection between marketing activities and business results. When a board member questions the effectiveness of a specific campaign, CMOs can immediately show not only the campaign metrics, but also its direct and assisted revenue contribution.
Catalyst Pro’s visualization tools include interactive timelines that show the relationship between marketing initiatives and revenue increases, making it easy for executives to see the cause and effect. Heat maps show the most effective channels and campaigns based on ROI, and funnel visualizations show how marketing effectively moves prospects through the buying process. These visual aids help close the communication gap between the technical metrics used by marketing and the business impact that the board is focused on.
Personalized KPI Dashboards for Board Presentations
Every board has its own priorities and metrics that they hold in high regard. Catalyst Pro recognizes this fact by offering highly personalized dashboards that are designed specifically for executive presentations. CMOs can create views that are specific to the board that emphasize the metrics that are most relevant to strategic discussions. This could be pipeline contribution, customer acquisition efficiency, or the impact that marketing has on target market penetration. These personalized dashboards make sure that marketing leaders always present the most convincing and relevant data story to their audience.
Catalyst Pro’s platform can be customized to fit different executive personas, allowing for multiple dashboard configurations. For example, a CFO’s dashboard might focus on ROI and cost efficiency metrics, while a CEO’s view might emphasize market share gains and competitive positioning. This customization also extends to terminology, allowing marketing leaders to present data using the specific language and KPIs that the board is already familiar with.
CMOs can save and improve dashboard templates over time, building a growing library of presentations ready for board meetings. This readiness means that CMOs never have to start from the beginning when preparing for crucial meetings and can concentrate on creating insights rather than gathering data. With one click, the platform’s presentation mode turns these dashboards into professional slides, making the shift from analysis to presentation seamless. For those interested in further enhancing their marketing strategies, exploring building topical authority can be a valuable resource.
5 Key Metrics That Show Board Members the Value of Marketing
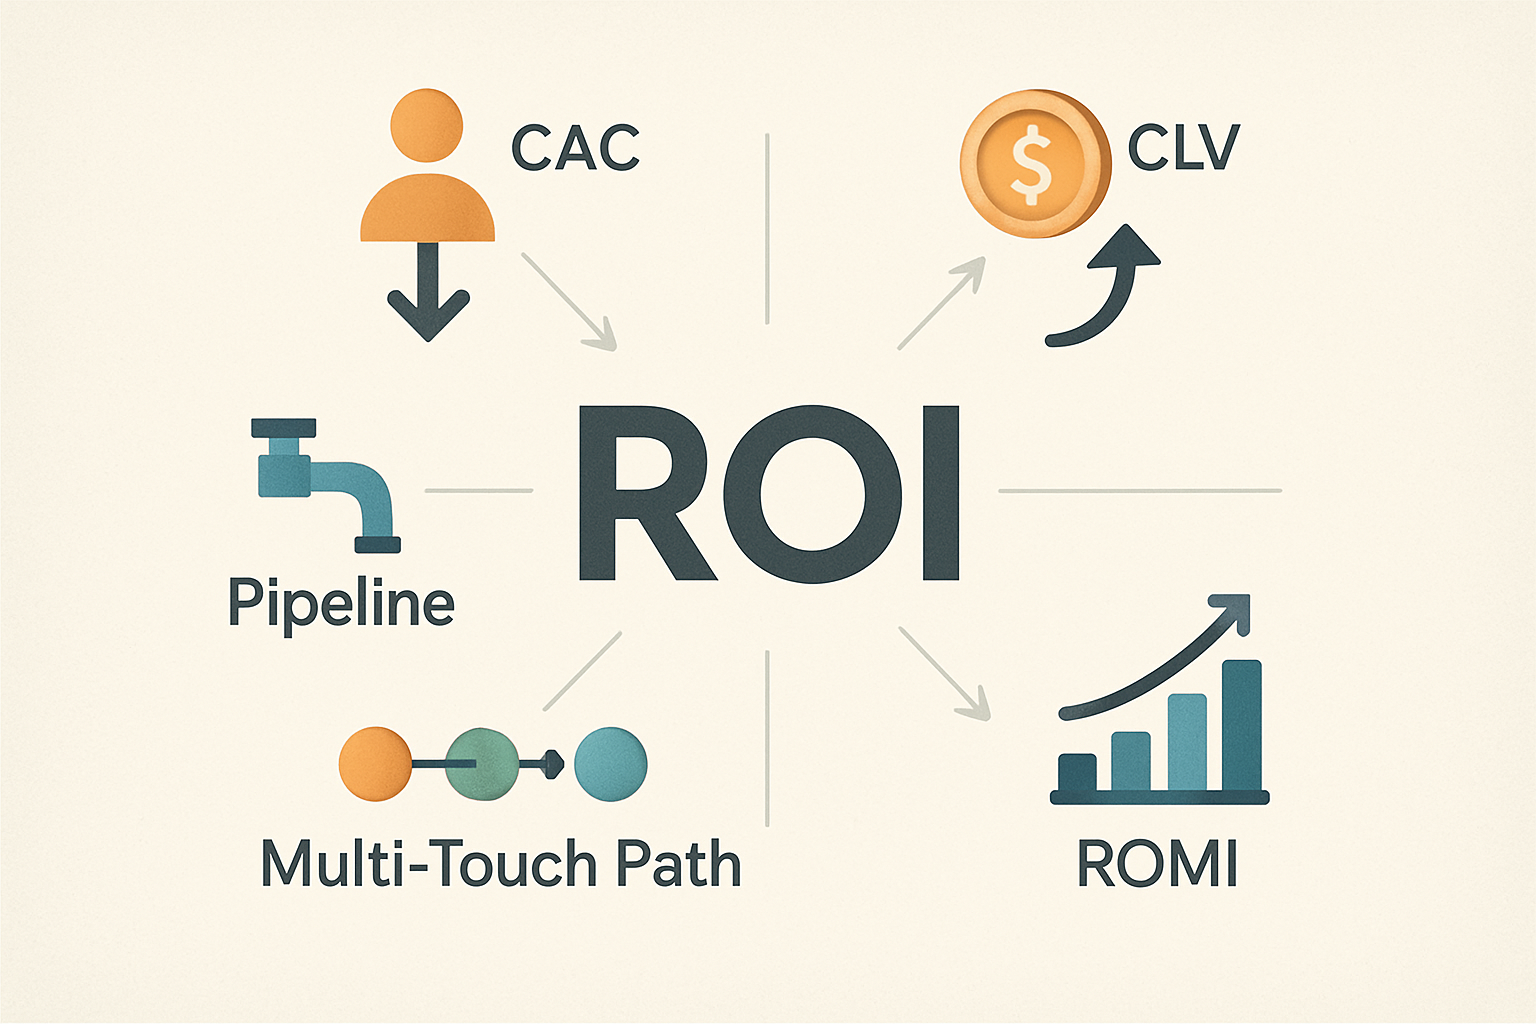
When dealing with doubtful board members, not all metrics are created equal. Catalyst Pro enables CMOs to concentrate on the financial and results-driven KPIs that are most relevant to executives who are concerned with business expansion. These five metrics have been especially successful in illustrating the strategic importance of marketing and ensuring ongoing investment.
1. Customer Acquisition Cost (CAC) Breakdown by Channel
Board members are instantly drawn to the cost of acquiring new customers, especially when they can compare it to other companies. Catalyst Pro provides an accurate calculation of CAC by channel, campaign, and customer segment, showing which acquisition strategies provide the most cost-effective growth. This detailed perspective allows CMOs to show how they’re optimizing spend and continuously improving acquisition efficiency.
The CAC visualization on the platform shows trends over time, and it emphasizes how marketing innovations have decreased acquisition costs while maintaining or increasing the quality of customers. For boards that are worried about sustainable growth, this metric speaks directly to the economic feasibility of expansion plans. When a CMO can show a decrease in CAC in key segments while competitors are struggling with increasing acquisition costs, it changes the budget conversation from cost control to strategic advantage.
2. Revenue Pipeline Influenced by Marketing
Catalyst Pro measures more than just direct attribution. It also calculates the wider impact marketing has on the sales pipeline, capturing value that other models overlook. The platform monitors how marketing activities speed up deals, boost average deal size, and enhance win rates—even when marketing isn’t the source of origination. This complete perspective stops boards from underestimating the role marketing plays in generating revenue.
The pipeline influence dashboard showcases the impact of marketing content, events, and nurture programs on opportunity progression at each sales stage. It shows, for instance, how prospects exposed to thought leadership content have higher conversion rates or how nurture campaigns shorten sales cycles by specific percentages. These insights assist board members in understanding the role of marketing in making the entire revenue engine more efficient, not just in generating leads.
3. Ratio of Customer Lifetime Value to Customer Acquisition Cost
No metric shows marketing’s strategic impact better than the ratio between customer lifetime value (CLV) and acquisition cost. Catalyst Pro automatically works out this crucial ratio across segments, revealing which customer acquisition investments yield the highest long-term returns. For boards focused on sustainable growth, this metric changes the perception of marketing from a cost center to a strategic investment with measurable returns.
Catalyst Pro’s platform tracks over time how marketing strategies aimed at increasing customer loyalty, retention, and opportunities for upselling affect CLV. For instance, CMOs can show how content marketing strategies increase product usage and decrease churn, or how customer marketing campaigns generate expansion revenue. These insights change the board’s discussions from quarterly campaign results to establishing long-term customer relationships that increase the value of the company. For more insights, check out this guide for CMOs on proving marketing ROI.
4. Using Multi-Touch Attribution Models to Justify Marketing Budget
Catalyst Pro’s advanced attribution modeling system offers a more detailed and accurate view than basic first-touch or last-touch models. It accurately assigns credit across the entire customer journey. The platform provides a variety of attribution models. These range from position-based models to time-decay models, to custom algorithmic models. These models accurately reflect the complexity of both B2B and B2C purchasing processes. This detailed attribution allows CMOs to justify investments in awareness and consideration stage marketing. These investments may otherwise seem unrelated to revenue. For more insights, read about proving marketing ROI to the C-suite.
The comparative attribution dashboard illustrates the different channels’ contribution to conversions under various models, thus exposing the actual value of upper-funnel activities. When board members challenge brand marketing investments, CMOs can show how these initiatives start customer journeys that eventually convert. The platform’s attribution insights allow marketing leaders to optimize channel mix and budget allocation with confidence, supported by data that links all marketing touchpoints to revenue outcomes.
5. Campaign Return on Marketing Investment (ROMI)
While many analytics platforms offer basic ROI calculations, Catalyst Pro delivers a detailed Return on Marketing Investment metrics that account for the full financial impact of marketing activities. The platform factors in not just campaign costs and direct revenue, but also influenced revenue, operational efficiencies, and time-to-value acceleration. This comprehensive approach ensures boards see marketing’s complete contribution to business performance. For more insights, check out this guide on measuring ROI for chief marketing officers.
The Return on Marketing Investment (ROMI) dashboard offers a way to compare various campaigns, channels, and time periods, and identify the most profitable initiatives. It includes confidence intervals that recognize the inherent uncertainty of attribution but still provide actionable insights. For CMOs facing budget scrutiny, the ability to rank marketing investments by verified returns is a powerful tool to justify continued or increased funding. For more insights, check out this guide for CMOs on proving marketing ROI to the C-suite.
Enhance Your Board Presentations with Catalyst Pro’s Data Visualization
Raw data can be converted into persuasive insight with the right presentation. Catalyst Pro can turn intricate marketing analytics into visual narratives that strike a chord with executive audiences. The platform’s visualization features exceed the usual charts and graphs to create interactive data experiences that address board members’ inquiries immediately, strengthening their faith in marketing’s strategic direction.
Turning Complicated Data into a Simple Executive Story
CMOs use Catalyst Pro’s narrative-building tools to create persuasive data stories that illustrate the impact of marketing on the business. The platform automatically finds the most important insights and trends and suggests the best visualizations to explain each point. This guidance allows marketing leaders to concentrate on the metrics and relationships that board members care about the most, avoiding a data overload that can hide the main message.
The presentation builder of the platform merges these visualizations into cohesive narratives that adhere to tried and tested executive communication frameworks. CMOs can create data-driven stories that set the business context, show the contribution of marketing, and project future impact based on trend analysis. These structured narratives ensure that even technically complex marketing concepts are translated into business insights that resonate with C-suite executives.
Instantaneous Data Exploration for Impromptu Board Queries
Even when CMOs come prepared, board presentations can lead to unforeseen questions. With Catalyst Pro’s interactive dashboards, marketing leaders can confidently reply to these queries with immediate data exploration. Instead of postponing answers to subsequent emails, CMOs can delve right into the details from high-level metrics to address the board’s specific inquiries.
With Catalyst Pro, CMOs can filter data by time period, customer segment, geographic region, or any custom dimension. This feature allows them to respond to board questions in real-time. For instance, if a board member asks about performance in a specific market or with a particular customer type, the CMO can immediately adjust the visualization to show precisely the requested information. This ability to adapt on the fly turns potentially challenging moments into opportunities to demonstrate marketing’s data-driven approach and deep understanding of business dynamics.
These interactive capabilities also encompass scenario modeling that can tackle future-oriented questions about marketing strategy. If board members inquire about the expected returns from increased investment in certain channels, CMOs can use Catalyst Pro’s prediction tools to model various spending scenarios and their probable outcomes based on historical performance data. This capability to respond to “what if” questions with data-supported projections significantly boosts marketing’s strategic credibility.
Three CMOs Who Earned Larger Budgets with Catalyst Pro
The best proof of Catalyst Pro’s effectiveness in elevating the strategic importance of marketing comes from success stories. Here are three real-life cases of CMOs who used the platform to alter the board’s view of marketing and win larger budgets for marketing projects.
CloudSecure Boosts Marketing Budget by 30%
Upon being appointed CMO at enterprise SaaS company CloudSecure, Sarah Chen took over a marketing department that was having trouble demonstrating its worth. Despite the implementation of advanced demand generation programs, the prior marketing leadership was unable to link activities to revenue in a manner that appeased the board’s examination. For three straight years, marketing budgets had remained unchanged while the number of sales staff continued to rise.
Chen started using Catalyst Pro in her first quarter, and integrated data from their marketing automation platform, CRM, and advertising channels. The unified dashboard showed that marketing’s influence on the pipeline was significantly undervalued – when properly attributed, marketing influenced 72% of closed revenue, not the 23% previously reported. The most revealing discovery was that deals influenced by marketing content closed 40% faster and at 35% higher values than deals not influenced by marketing.
In her initial board presentation using Catalyst Pro visualizations, Chen showed how specific content investments had sped up enterprise sales cycles, directly addressing the CEO’s priority of reducing time-to-close for their largest deals. The board approved a 30% budget increase focused on content marketing and ABM programs targeting enterprise accounts – a significant departure from previous budget constraints.
“Catalyst Pro has changed the way our board thinks about marketing. We’ve gone from having to justify our department’s existence to discussing how marketing can further accelerate growth. The platform’s ability to connect our activities directly to revenue metrics that matter to the board has completely changed the conversation.” – Sarah Chen, CMO, CloudSecure
HomeStyle Uses Catalyst Pro to Prove ROI of Digital Transformation
Traditional retailer HomeStyle was facing declining foot traffic and increasing competition from direct-to-consumer brands. CMO Marcus Washington needed to secure a significant investment in digital transformation initiatives but faced skepticism from a board accustomed to traditional metrics like store traffic and same-store sales.
Washington employed Catalyst Pro to track customer journeys across digital touchpoints and in-store purchases, implementing cross-channel attribution. This platform showed that digital engagement that occurred before store visits led to average transaction values that were 3.2x higher and customer retention rates that were 28% better. Additionally, the analytics revealed that the lifetime value of omnichannel customers was 4.1x that of single-channel shoppers.
With this information, Washington crafted a powerful data story that showed how particular digital investments would enhance in-store performance metrics that the board already appreciated. His presentation used Catalyst Pro’s scenario modeling to demonstrate the anticipated ROI for each stage of their digital transformation roadmap. The board approved the entire three-year investment plan, with the CEO specifically mentioning the obvious link between digital initiatives and key business metrics as the deciding factor.
From Old School to New School: B2B Manufacturer Makes the Digital Leap
When Jennifer Mercer was appointed CMO at PrecisionTech, a company that manufactures industrial equipment, she was tasked with bringing the company’s marketing strategy into the 21st century. In the past, PrecisionTech had always used trade shows, print ads, and a direct sales force, with little to no support from digital marketing. The board, made up mostly of industry veterans, was hesitant to move budget away from tried-and-true traditional channels and towards digital initiatives.
Mercer put Catalyst Pro to use to establish a standard for measuring their current marketing performance, which included data from sales reports, expense tracking, and the limited digital analytics they had on hand. The platform showed that their trade show investments, while generating visible activity, were producing a negative ROI when fully loaded costs were taken into account. Meanwhile, their small-scale digital campaigns were delivering cost-per-opportunity metrics that were 4x better.
By leveraging the comparative channel analytics feature of Catalyst Pro, Mercer was able to show how a strategic shift of 40% of the trade show budget to targeted digital campaigns could boost the number of qualified leads by a projected 67%, while simultaneously decreasing the overall CAC by 28%. The board members were able to see exactly how these budget changes would affect the pipeline and projected revenue across different market segments, thanks to the visualization tools. Despite some initial reluctance, the board agreed to the reallocation, with checkpoints for review set for each quarter. By the time of the second quarter review, the actual results were exceeding even the most optimistic projections, resulting in the board fully endorsing Mercer’s digital-first strategy.
Get Catalyst Pro Up and Running in Just 4 Weeks: Your 30-Day Plan
Getting a complex marketing analytics platform up and running may seem like a huge task, but Catalyst Pro is designed for quick setup and immediate value. This four-week setup plan has been perfected through hundreds of large-scale setups to deliver insights ready for the board in just one quarter.
Week 1: Merging and Setting Up Data
The first step in implementing Catalyst Pro is to link your current marketing and sales data sources to the platform. Catalyst Pro comes with pre-existing connectors for popular marketing automation platforms, CRM systems, advertising networks, web analytics tools, and financial systems. Your implementation team will map data fields, ensure naming conventions are consistent, and confirm that data is accurate across all sources during this phase.
This week, we’ll focus on identifying any missing data that might need further tracking implementation. We’ll also set up parameters for importing historical data and configure security and access controls. The platform’s data quality monitoring tools will alert us to any inconsistencies or anomalies that could affect the accuracy of our analysis. This will allow us to correct any issues before we start building attribution models.
After the first week, the primary data sources should be linked and the initial data should be flowing into the system. The implementation team will confirm that the integration was successful by checking sample reports that validate key metrics against source systems. This ensures that all subsequent analytics are based on reliable and comprehensive data.
|
Source of Data |
Method of Integration |
Time of Implementation |
|---|---|---|
|
CRM (Such as Salesforce) |
Connection through Native API |
1-2 days |
|
Automation of Marketing |
Connection through Native API |
1-2 days |
|
Analytics of Web |
Native API or JavaScript tracking |
1 day |
|
Platforms for Advertising |
Connections through Native API |
1-3 days |
|
Systems for Finances |
API or export of data on a schedule |
2-3 days |
Week 2: The Setup for Attribution Models
Week 2 is focused on setting up the attribution models that will properly credit marketing activities with business outcomes now that data is flowing into the system. Catalyst Pro offers a variety of attribution methodologies, from simple first/last touch models to sophisticated algorithmic approaches that distribute credit based on your specific customer journey patterns. The team for implementation will analyze your sales cycles, typical customer journeys, and existing attribution preferences to recommend the most appropriate models.
In this stage, you’ll identify the conversion events that are important to your company, such as generating leads, creating opportunities, and closing deals. The program will track the touchpoints that affect these conversions and set suitable look-back periods based on the length of your sales cycle. For businesses with complicated B2B sales procedures, this could involve weighted influence models that consider opportunities for speeding up and expanding deals.
After the first two weeks, your initial attribution models will begin to process historical data, uncovering new insights into which marketing activities are actually driving your business results. These initial models often reveal surprising patterns that challenge traditional assumptions about the effectiveness of channels, providing immediate strategic value even before creating board presentations. For instance, exploring Pinterest for B2B might uncover a hidden lead generation platform that was previously underestimated.
Week 3: Tailoring the Dashboard for Your Board
Once the data is streaming and the attribution models are working, Week 3 is all about crafting the visual narratives that will strike a chord with your particular board members. The implementation team will collaborate with you to grasp the metrics your board values the most, the business questions they often ask, and the presentation style that fits with your organization’s communication standards. This joint effort guarantees that the dashboards you design will tackle your board’s particular worries and priorities.
This week, you’ll be creating and fine-tuning dashboards that are ready to be presented to the board, focusing on the most persuasive metrics that you’ve identified through your attribution models. The platform’s template library offers a variety of starting points based on typical board scenarios, whether you’re looking at growth-focused metrics for a venture-backed company or efficiency metrics for a more established organization. These templates can be personalized with your own branding, language, and specific KPIs to create sleek, professional presentations.
It is essential during this stage to create benchmark comparisons that give your metrics a sense of context. Catalyst Pro can include industry benchmarks, competitive intelligence, and your own past performance to present not just raw data but valuable comparisons that show the relative performance of marketing. At the end of Week 3, you will have a full set of dashboards ready for the board that powerfully illustrate the business impact of marketing.
Week 4: Practicing Your Data-Driven Story
The last week of implementation is all about getting you and your team ready to confidently share your new findings with the board. This starts with developing your narrative – creating the story that links your metrics to the company’s priorities and strategic goals. Your implementation team will assist in pinpointing the most interesting insights that the platform has uncovered and organizing them into a convincing presentation.
During the week, you’ll have practice sessions that let you get the hang of moving around the interactive dashboards during real-time presentations. You’ll practice answering the usual questions from the board using the platform’s drill-down capabilities, which will make sure you can answer detailed questions with confidence and without losing your stride. These sessions usually include scenario planning for difficult questions and ways to steer the conversation back to the strengths shown by marketing.
At the end of the week, there are final adjustments to the dashboard based on feedback from the rehearsal and a technical readiness check to make sure everything runs smoothly during the actual board meeting. Many CMOs also use the export features of Catalyst Pro to create pre-meeting briefing materials, which give board members a chance to see key metrics before the full presentation.
“The rehearsal support from the Catalyst Pro team was invaluable. They anticipated questions our board would ask that I hadn’t even considered, and showed me exactly how to navigate to the relevant data in real-time. When those exact questions came up in the actual meeting, I was completely prepared.” – Marketing VP, Enterprise Software Company
Beyond Numbers: Using Catalyst Pro to Tell Your Marketing Story
While data and metrics form the foundation of board-level reporting, the most successful CMOs use Catalyst Pro to craft compelling narratives that place marketing at the center of business strategy. The platform’s storytelling capabilities help transform abstract numbers into meaningful business insights that demonstrate marketing’s full strategic value. For more insights, you can explore this how-to guide for CMOs on proving marketing ROI.
Linking Marketing Efforts to Business Goals
With the business alignment tools provided by Catalyst Pro, CMOs can clearly illustrate how certain marketing efforts are helping to achieve the company’s strategic goals. The platform enables you to directly connect marketing efforts to business goals, demonstrating exactly how different campaigns and programs are helping to achieve company-wide goals such as expanding into new markets, differentiating from competitors, or improving customer experience. The ability to align in this way changes the way reporting is done, moving from isolated marketing metrics to a more integrated view of business contributions.
With the help of Catalyst Pro’s objective linking dashboard, marketing campaigns can be visually linked to strategic priorities, clearly showcasing the alignment between marketing investments and business goals. This feature is particularly useful for boards that are worried about the strategic relevance of marketing, as it provides a clear link between activities and objectives, giving them peace of mind. When marketing leaders can show that 85% of their budget directly supports the company’s top three strategic priorities, it fundamentally changes the way executives view the role of marketing.
Measuring Brand Equity and Awareness Campaigns
Brand building and awareness activities have always been one of the most difficult areas to show ROI in marketing. Catalyst Pro solves this problem with advanced correlation analysis that links brand metrics to business outcomes over the right timeframes. The platform’s brand impact visualization shows how changes in brand awareness, consideration, and preference metrics correlate with pipeline development, sales conversion rates, and customer acquisition costs.
CMOs who are focusing on long-term brand building can use these correlations to demonstrate that brand investments provide tangible business value, even when direct attribution isn’t possible. The predictive modeling capabilities of the system can project how improvements in current brand metrics are likely to impact revenue outcomes in future quarters. This helps boards to see brand marketing as a strategic investment, rather than a discretionary expense.
Transforming Your Next Board Meeting into a Strategic Partnership
CMOs who successfully implement Catalyst Pro aim to do more than just improve their reporting. They want to change the way marketing interacts with the board. By using the platform’s capabilities, CMOs can transition from justifying their budget to becoming strategic partners in business growth. This shift in roles can help increase the standing and influence of the marketing department within the organization. For more insights on leveraging tools for business growth, explore lead scoring for SMBs.
Marketing leaders who come to board meetings with concrete, data-based insights about market opportunities, competitive positioning, and customer behavior are seen as valuable strategic advisors instead of just cost center managers. Catalyst Pro’s predictive capabilities allow CMOs to lead discussions about market evolution and growth strategies that look to the future. Instead of just reporting on past performance, marketing can guide strategic conversations about future opportunities.
CMOs can use the platform’s scenario modeling tools to propose different investment strategies, each with a projected outcome based on past performance data. This means that when the board is discussing strategic priorities, marketing leaders can instantly model the pipeline and revenue implications of various investment scenarios. This feature allows marketing to go from being a budget line item to a strategic lever for business growth.
“Since implementing Catalyst Pro, I spend 80% less time defending marketing’s budget and 80% more time discussing how marketing can help solve strategic business challenges. The conversation has completely shifted from ‘Why do you need this money?’ to ‘How can we allocate resources to maximize growth?'” – Enterprise CMO
This shift from defense to partnership creates a virtuous cycle for marketing organizations. As boards gain confidence in marketing’s strategic value and measurement rigor, they become more willing to approve innovative programs and longer-term investments. This expanded mandate allows marketing to pursue more ambitious initiatives that further enhance business impact, continuously strengthening marketing’s strategic position. For example, exploring Pinterest for B2B can be a hidden lead generation platform that supports these strategic goals.
Commonly Asked Questions
- How soon will I see ROI from Catalyst Pro?
- Can Catalyst Pro work with our current martech stack?
- How does Catalyst Pro manage offline marketing channels?
- What’s the learning process for my marketing team to use Catalyst Pro effectively?
- How do other CMOs use Catalyst Pro to predict future marketing performance?
How soon will I see ROI from Catalyst Pro?
Most marketing teams begin to see tangible results from Catalyst Pro within the first 30 days of implementation. The initial data integration often reveals attribution insights that immediately identify opportunities for budget optimization – many CMOs report finding 15-20% of their marketing budget allocated to underperforming channels that can be quickly redirected. The full ROI timeline depends on your reporting cycles and board meeting frequency, but customers typically report that their first board presentation using the platform results in either budget increases or significantly enhanced strategic credibility, delivering immediate organizational value.
Is Catalyst Pro compatible with our current martech stack?
Open integration was a key factor in the development of Catalyst Pro, which provides ready-made connectors for over 150 business, sales, and marketing systems. The platform is capable of establishing native API connections with leading CRM platforms (Salesforce, Microsoft Dynamics, HubSpot), marketing automation systems (Marketo, Eloqua, HubSpot, Pardot), advertising platforms (Google, Facebook, LinkedIn, Twitter), web analytics tools (Google Analytics, Adobe Analytics), and financial systems (NetSuite, QuickBooks, SAP).
If your systems do not have pre-built connectors, Catalyst Pro provides a variety of options for importing data. These include SFTP file transfers, CSV uploads, and custom API integrations. During the scoping process, the implementation team will evaluate your specific martech ecosystem to determine the best integration approach for your setup.
How does Catalyst Pro manage offline marketing channels?
Catalyst Pro includes offline marketing activities using a variety of tracking methods. For direct mail and print campaigns, the platform supports vanity URLs, QR codes, and unique phone numbers that link offline touchpoints to digital responses. Event marketing (trade shows, conferences, field events) can be tracked through badge scans, check-in systems, and post-event surveys that integrate with the attribution platform. For broadcast media, the system correlates airtime data with website traffic patterns and direct response metrics to establish attribution relationships.
How quickly can my marketing team learn to use Catalyst Pro effectively?
Catalyst Pro was created with the needs of marketing professionals at the forefront, with an emphasis on user-friendly interfaces and analytics that guide the user and don’t require a background in data science. Most marketing teams are able to use the basic functions within their first week, and can create dashboards and explore the system interactively within the first month. The process of implementing the system includes training sessions that are tailored to different roles – from marketing operations specialists who may set up advanced attribution models to marketing executives who mainly need to present and explore. Ongoing support includes a comprehensive knowledge base, regular drop-in sessions with analytics experts, and reviews of system optimization every quarter.
How are other CMOs using Catalyst Pro to predict future marketing performance?
Catalyst Pro’s predictive analytics capabilities have become a crucial strategic tool for progressive CMOs. The platform’s forecasting models examine past performance patterns, seasonal trends, and conversion rates to predict future results from current marketing activities. Many CMOs use these capabilities to model different investment scenarios before annual planning cycles, showing projected pipeline and revenue impacts of various budget allocations.
The savviest users utilize the platform’s AI-powered scenario planning to fine-tune channel mix according to business goals – be it maximizing overall revenue, enhancing acquisition efficiency, or penetrating particular market segments. These forecasting capabilities are especially useful when launching new products or breaking into new markets where there may be a dearth of historical data. The system can draw from similar past initiatives to generate plausible performance projections that inform strategic decision-making.
When CMOs use the power of Catalyst Pro to blend historical performance analysis with predictive projections, they become strategic business planners instead of just marketing executors. This foresight often becomes the most valuable feature of the platform for senior marketing leaders who are focused on long-term strategic impact.
Prove marketing’s impact in your next board meeting. Turn messy data into executive-ready ROI stories with Catalyst Pro—see how at trycatalystpro.com.

